The matplotlib.pyplot.autoscale function in the matplotlib.pyplot module is used to autoscale the axis view to the data (toggle).
Convenience method for simple axis view autoscaling. It turns autoscaling on or off, and then, if autoscaling for either axis is on, it performs the autoscaling on the specified axis or Axes.
matplotlib.pyplot.autoscale Syntax
The syntax of the matplotlib.pyplot.autoscale method is as follows:
matplotlib.pyplot.autoscale(enable=True, axis='both', tight=None)matplotlib.pyplot.autoscale Parameters
The matplotlib.pyplot.autoscale accepts the following parameters:
| Parameter | Description |
|---|---|
enable |
bool or None, default: True True turns autoscaling on, False turns it off. None leaves the autoscaling state unchanged. |
axis |
{'both', 'x', 'y'}, default: ‘both’Which axis to operate on. |
tight |
bool or None, default: None If True, first set the margins to zero. Then, this argument is forwarded to autoscale_view (regardless of its value); see the description of its behavior there. |
matplotlib.pyplot.autoscale Returns
The python matplotlib.pyplot.autoscale function doesn’t return any value.
Demo #1: Basic usage of matplotlib.pyplot.autoscale
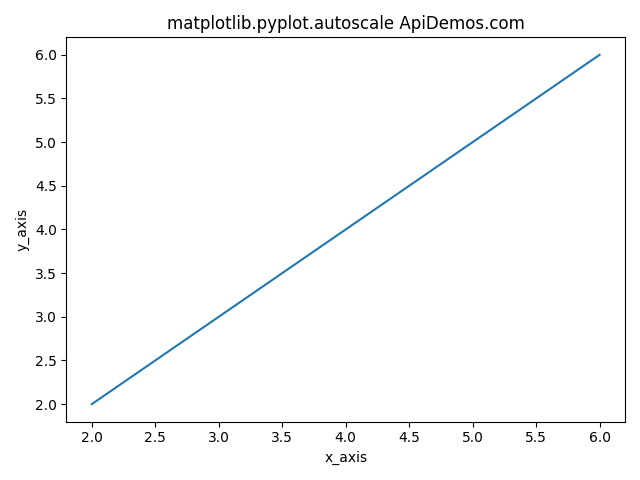
The following example demonstrates the use of the matplotlib.pyplot.autoscale method −
# Demo of matplotlib.pyplot.autoscale function

import matplotlib.pyplot as plt

x = [2,4,6]
y = [2,4,6]
plt.plot(x, y)

plt.xlabel('x_axis')
plt.ylabel('y_axis')

plt.autoscale()

plt.title('matplotlib.pyplot.autoscale ApiDemos.com')
plt.show()
When we run above program, it produces following result −

 ApiDemos™