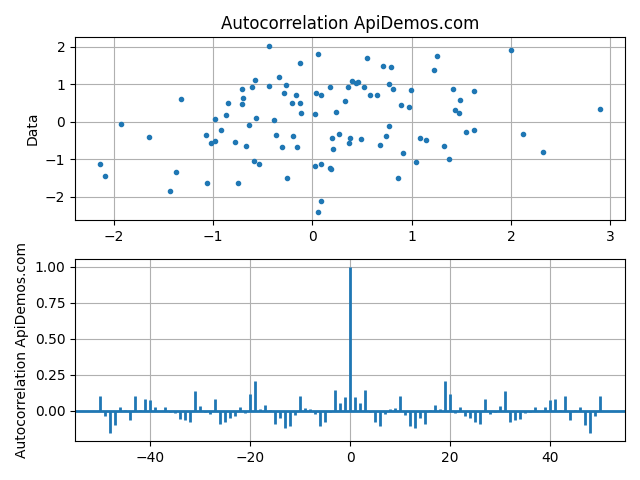
The matplotlib.pyplot.acorr function in the matplotlib.pyplot module is used to plot the autocorrelation of x.
matplotlib.pyplot.acorr Syntax
The syntax of the matplotlib.pyplot.acorr method is as follows:
matplotlib.pyplot.acorr(x, *, data=None, **kwargs)matplotlib.pyplot.acorr Parameters
The matplotlib.pyplot.acorr accepts the following parameters:
| Parameter | Necessity | Description |
|---|---|---|
x |
Required | array-like, A sequence of scalars. |
detrend |
Optional | A detrending function applied to x. callable, default: mlab.detrend_none (means no detrending)
It must have the signature: |
normed |
Optional | A Boolean value, default: True If True, input vectors are normalized to unit length. |
usevlines |
Optional | A Boolean value, default: True. Determines the plot style. If True, vertical lines are plotted from 0 to the acorr value using Axes.vlines. Additionally, a horizontal line is plotted at y=0 using Axes.axhline.If False, markers are plotted at the acorr values using matplotlib.axes.Axes.plot. |
maxlags |
Optional | An integer value, default: 10 Number of lags to show. If None, will return all 2 * len(x) - 1 lags. |
linestyle |
Optional | A Line2D object.The linestyle for plotting the data points. Only used if usevlines is False. |
marker |
Optional | A string value, default: ‘o’. The marker for plotting the data points. Only used if usevlines is False. |
data |
Optional | indexable object. If given, the x parameters also accept a string s, which is interpreted as data[s] |
**kwargs |
Optional | Additional parameters are passed to Axes.vlines and Axes.axhline if usevlines is True; otherwise they are passed to Axes.plot. |
matplotlib.pyplot.acorr Returns
The return value of the matplotlib.pyplot.acorr function is as follows :
| Return Value | Description |
|---|---|
lags |
array (length 2*maxlags+1)The lag vector. |
c |
array (length 2*maxlags+1)The auto correlation vector. |
line |
LineCollection or Line2D Artist added to the Axes of the correlation: LineCollection if usevlines is True.Line2D if usevlines is False. |
b |
Line2D or None Horizontal line at 0 if usevlines is True None usevlines is False. |
Demo #1: Basic usage of matplotlib.pyplot.acorr
The following example demonstrates the use of the matplotlib.pyplot.acorr method −
# Demo of matplotlib.pyplot.acorr() function
import matplotlib.pyplot as plt
import numpy as np

x, y = np.random.randn(2, 100)

plt.figure()
plt.subplot(211)
plt.plot(x, y, '.')
plt.title('Autocorrelation ApiDemos.com')
plt.ylabel('Data')
plt.grid(True)

plt.subplot(212)
# Plot autocorrelation
plt.acorr(x, usevlines=True, normed=True, maxlags=50, lw=2)
# plt.acorr(x, maxlags = 9)
plt.ylabel('Autocorrelation ApiDemos.com')
plt.grid(True)

plt.show()
When we run above program, it produces following result −

 ApiDemos™