The matplotlib.pyplot.arrow function in the matplotlib.pyplot module is used to add an arrow to the Axes.
This draws an arrow from (x, y) to (x+dx, y+dy).
matplotlib.pyplot.arrow Syntax
The syntax of the matplotlib.pyplot.arrow method is as follows:
matplotlib.pyplot.arrow(x, y, dx, dy, **kwargs)matplotlib.pyplot.arrow Parameters
The matplotlib.pyplot.arrow accepts the following parameters:
| Parameter | Description |
|---|---|
x, y |
float The x and y coordinates of the arrow base. |
dx, dy |
float The length of the arrow along x and y direction. |
width |
float, default: 0.001 Width of full arrow tail. |
length_includes_head |
bool, default: False True if head is to be counted in calculating the length. |
head_width |
float or None, default: 3*widthTotal width of the full arrow head. |
head_length |
float or None, default: 1.5*head_widthLength of arrow head. |
shape |
{'full', 'left', 'right'}, default: 'full'Draw the left-half, right-half, or full arrow. |
overhang |
float, default: 0 Fraction that the arrow is swept back (0 overhang means triangular shape). Can be negative or greater than one. |
head_starts_at_zero |
bool, default: False If True, the head starts being drawn at coordinate 0 instead of ending at coordinate 0. |
**kwargs |
helps in adding properties to arrow, like adding color to arrow, changing width of arrow |
matplotlib.pyplot.arrow Returns
The return value of the matplotlib.pyplot.arrow function is FancyArrow.
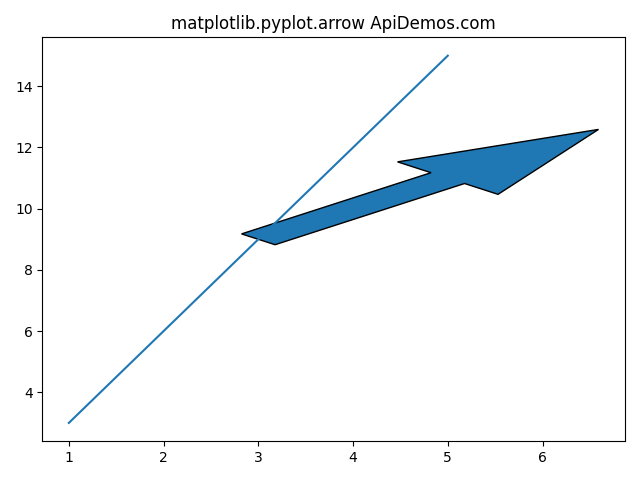
Demo #1: Basic usage of matplotlib.pyplot.arrow
The following example demonstrates the use of the matplotlib.pyplot.arrow method −
# Demo of matplotlib.pyplot.arrow function

import matplotlib.pyplot as plt

x =[1, 2, 3, 4, 5]
y =[3, 6, 9, 12, 15]

plt.plot(x, y)

# Add arrows from the bottom (3,9), x and y by 2 units each,
# and set the width of the arrows
plt.arrow(3, 9, 2, 2, width=0.5)

plt.title('matplotlib.pyplot.arrow ApiDemos.com')
plt.show()
When we run above program, it produces following result −

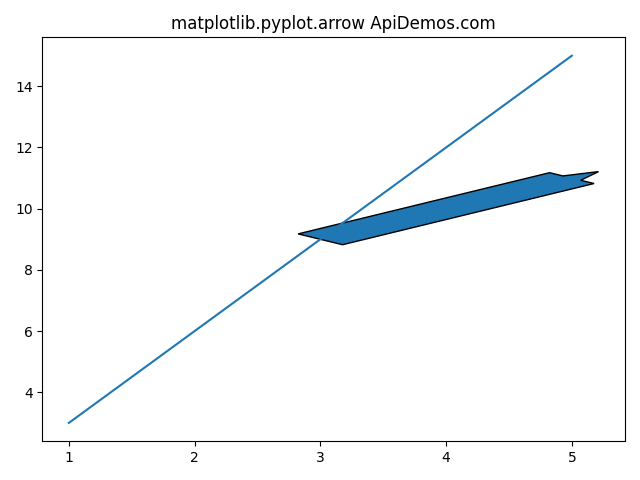
Demo #2:Increase head_width of the arrow
Increase head_width of the arrow
# Demo of matplotlib.pyplot.arrow function

import matplotlib.pyplot as plt

x =[1, 2, 3, 4, 5]
y =[3, 6, 9, 12, 15]

plt.plot(x, y)

# Add arrows from the bottom (3,9), x and y by 2 units each,
# and set the width of the arrows
plt.arrow(3, 9, 2, 2, width=0.5, head_width=0.2)

plt.title('matplotlib.pyplot.arrow ApiDemos.com')
plt.show()
When we run above program, it produces following result −

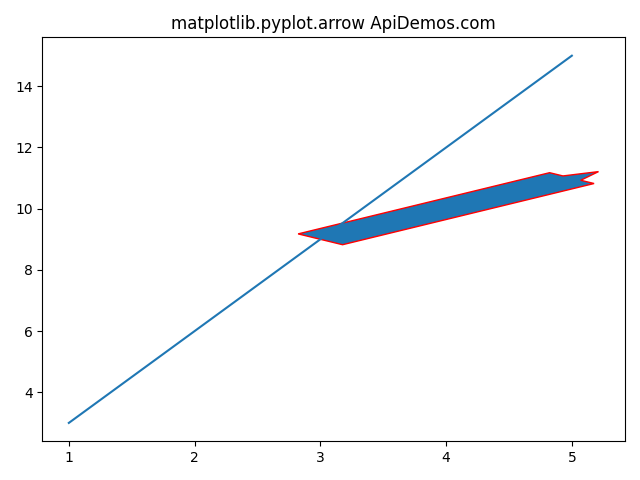
Demo #3: Changing the edge color to red
Changing the edge color to red:
# Demo of matplotlib.pyplot.arrow function

import matplotlib.pyplot as plt

x =[1, 2, 3, 4, 5]
y =[3, 6, 9, 12, 15]

plt.plot(x, y)

# Add arrows from the bottom (3,9), x and y by 2 units each,
# and set the width of the arrows and Changing the edge color to red.
plt.arrow(3, 9, 2, 2, width=0.5, head_width=0.2, ec ='red')

plt.title('matplotlib.pyplot.arrow ApiDemos.com')
plt.show()
When we run above program, it produces following result −

 ApiDemos™